

"Oh what a good time to be alive" by Arthur Rackham. Source: Wikigallery.
Published: April 21, 2013, 11:49 a.m., Last updated: April 6, 2018, 12:44 p.m.
On 6 August 2001, President Thabo Mbeki wrote a letter to his Minister of Health, Manto Tshabalala-Msimang, questioning the priorities of South Africa's social spending.
Using a 1995 World Health Organisation report, the President presented data showing that violence and accidents were the country's biggest cause of death. AIDS was only twelfth. The president wrote provocatively: 1 2
Needless to say, these figures will provoke a howl of displeasure and a concerted propaganda campaign among those who have convinced themselves that HIV/AIDS is the single biggest cause of death in our country.
This was against the background of a bitter fight, very much for life and death, between Mbeki and AIDS activists led by the Treatment Action Camapign. At its core this was a battle over whether the state should provide antiretroviral medicines. A couple of years later the journalist Rian Malan joined Mbeki's scepticism of AIDS being the country's leading cause of death, resulting in a widely publicised debate between him and me. 3
Among scientists who researched South Africa's epidemic and mortality data there was no controversy at all: AIDS was at the time of this controversy the biggest cause of death in South Africa. It still is, but as I will explain shortly there is much good news. We will never know the precise number of HIV infections and deaths but the estimates produced by researchers at the Medical Research Council and UCT's Centre for Actuarial Research during the late 1990s and early 2000s were plausible and the best possible given the information they had. They revised their estimates as new information became available; they still do. This is how the science of epidemics works.
Mbeki's efforts to stop the rollout of antiretroviral treatment were foiled by 2004. But between 2000 and 2005, at least 1 million people died of AIDS; hundreds of thousands of these deaths could have been prevented. 10 4 5 Today South Africa has by far the largest antiretroviral treatment programme in the world and a reasonably successful mother-to-child transmission prevention one too.
Two important recent studies, as well as one published in August last year, show that people in South Africa are living longer and that the number of deaths each year is declining. This follows a long period of declining life expectancy because of the HIV epidemic.
Leigh Johnson and colleagues recently published an article in PLoS Medicine. They showed that the near normal life-expectancy of people with HIV on antiretroviral treatment in high-income countries is being seen in South Africa too. 7
Using data from 2001 to 2010 of nearly 38,000 patients from six antiretroviral cohorts in the Western Cape, Gauteng and Kwazulu-Natal, they were able to compare the rate at which HIV-positive patients died to the general population. Just over 2,000 deaths were recorded on patient records. Of slightly more than 16,000 patients who were lost to the health system, they found, using the Department of Home Affairs' population register, that nearly 3,000 further patients had died. By plugging the rate of death in this large number of patients into a mathematical model they were able to make these calculations:
A man with HIV starting antiretroviral treatment at age 20 could expect to live, on average, a further 28 years.
A woman starting treatment at the same age could expect to live a further 37 years. However if her CD4 count was greater than 200 cells/mm3 when she started treatment she could expect to live a further 43 years.
A man starting treatment at age 60 could expect to live a further 10 years.
A woman starting treatment at the same age could expect to live a further 14 years.
People with HIV who started treatment with CD4 counts less than 50 cells/mm3 had about half the life expectancy of HIV-negative adults of the same age and sex.
People with HIV starting antiretroviral treatment at a CD4 count greater than 200 have a life expectancy of about 80% of HIV-negative people of the same age and sex. However, the difference between life-expectancy of HIV-positive and HIV-negative people was even smaller for people who had survived on treatment for at least two years, essentially people stable on treatment.
This is encouraging. It means that life-expectancy of people stable on treatment is approaching life-expectancy of people without HIV in South Africa, a phenomenon seen in rich countries too. The study has limitations however, as the authors explain. The average follow-up of patients was a bit less than two years, although as the researchers say, this likely leads to an underestimate of benefit because the risk of early death appears to come down the longer patients are on treatment. Another limitation is that these were well resourced urban public sector sites. The results might be very different in rural or private sector sites.
Every few years Statistics South Africa publishes comprehensive mortality data. Two weeks ago the latest report up till 2010 was released. In 1997 there were 317,000 recorded deaths in South Africa. This nearly doubled to a peak of 613,000 deaths in 2006. Although part of this increase was due to population growth and improved death registration, it was mainly due to the HIV epidemic. Since 2006, the number of deaths has declined annually:
604,000 in 2007,
596,000 in 2008,
580,000 in 2009 and
544,000 in 2010. 8
There is abundant evidence showing that the main cause of the rise in deaths from 1997 until 2007 was the HIV epidemic. One particularly compelling example is the age distribution of the deaths. As the annual number of deaths increased, more and more people were dying at younger ages. By 2000, adult women aged 30 to 34 were clearly dying in much greater numbers than older women. There is no alternative explanation for this other than the increasing death toll from AIDS. The following graph demonstrates this clearly. It compares mortality in adult women in Brazil in 2004 and South Africa in 1997 and 2004. Notice the way the age pattern of death changed in South Africa over seven years.
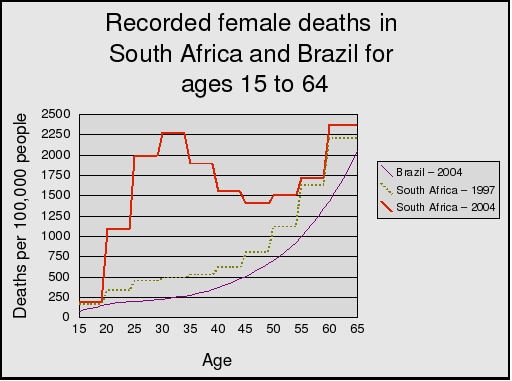
Constructed by Andrew Warlick and Nathan Geffen using mortality data from Statistics South Africa and Instituto Basileiro de Geografia e Estatistica.
Although the report does not say this, the decline in deaths in the last few years is mainly due to the wide-scale rollout of antiretroviral treatment and the resulting decline in AIDS deaths. It is difficult to know how many people are on antiretroviral treatment. Another study by Leigh Johnson published last year found that about 1.8 million people were on treatment by mid-2011, most of them in the public health system. 9 Now it is likely that well over 2 million people are on treatment. The vast majority of people on treatment live considerably longer than otherwise. Without treatment many more people would have died and the annual number of deaths in South Africa would have been much higher.
The data that Mbeki attached to his letter to Tshabalala-Msimang showed that murders, suicides and accidents--what are known as unnatural deaths--were the biggest contributors to mortality in 1995. Unnatural deaths are understandably a big source of concern for South Africans. So it is good news that the number of unnatural deaths has come down. The Stats SA report has data on unnatural deaths for every year since 1997 to 2010. Unnatural deaths were at their highest in 2007 at 54,500. They were at their lowest in 2010, at 48,000.
This appears to be mainly due to a drop in the number of murders, but we must be cautious. As the report says, "There was no consistent pattern observed with the number of non-natural deaths between 1997 and 2007. However, from 2008, the number of non-natural deaths decreased consistently."
The South African population has grown from about 43 million in 1997 to nearly 52 million in 2011 10 11, so there is also a drop in the rate of unnatural deaths. South African police statistics also show a decline in murders in recent years, from over 19,000 in 2006 to 15,600 in 2011. We will have to wait to see if this can be sustained and is not merely a random fluctuation.
The unnatural death picture is complicated by traffic accidents, which account for a large portion of them. There were just under 15,000 traffic deaths in 2007. 12 This dropped to 13,800 in 2010. 13 Consistent up-to-date annual traffic deaths are hard to find. The Road Traffic Management Corporation's (RTMC) estimates of road deaths are almost two thirds higher than Stats SA's and more accurate, but their website is disorganised and it is difficult to see trends in road deaths.
The decline in unnatural deaths is welcome news, but the reduction is tiny compared to natural deaths, a few thousand a year compared to a few tens of thousands. Neither in 2001 nor in 2013 could unnatural deaths explain the dramatic change in mortality happening to the South African population.
In August 2012, the Medical Research Council and the University of Cape Town's Centre for Actuarial Research published a report on mortality in South Africa. Their main source of data was the Department of Home Affairs' National Population Register. The Medical Research Council maintains a database of deaths obtained from the register, which the institution updates monthly. The data is not as complete as Stats SA, because unlike Stats SA it excludes people who died without a South African ID document or birth certificate, but it allows for more frequent reporting, which is why this publication is called the Rapid Mortality Surveillance (RMS) report. For comparison, the number of RMS deaths in 2009 was 488,000 (of which 45,000 unnatural) and the Stats SA deaths for 2009 were 544,000 (50,000 unnatural). Importantly, the trends seen in the Stats SA data are also seen in this data set.
The report concluded:
Life expectancy started to increase from about 2005. It can be seen that there have been sustained improvements in mortality of young adults and child mortality, largely due to the roll-out of [antiretroviral] treatment and prevention of mother-to-child transmission of HIV. However, neonatal mortality rates have not improved, and by 2009, maternal mortality was still increasing. [14]
The researchers calculated that life-expectancy at birth had risen from 57 in 2009 to 60 in 2011.
While there is much to be optimistic about, mortality in South Africa continues to be extremely high due to AIDS. The number of deaths in 2010 still far exceeds the number of deaths in 2001, and this cannot be explained only by population growth. The rollout of antiretroviral treatment has stemmed the drop in life-expectancy, but it is still very low, lower than it was in the early 1990s. 10 As explained by the Rapid Mortality Surveillance Report, maternal mortality was still increasing as of 2009.
The leading cause of recorded deaths in the Stats SA report remains tuberculosis, though this has dropped from 75,000 in 2008 to 63,000 in 2010. Other causes of death frequently associated with HIV infection have also declined. For example, the second-biggest cause of death, "influenza and pneumonia" has dropped from 46,000 in 2008 to 39,000 in 2010. "Intestinal infectious diseases", the third-biggest cause, has dropped from 40,000 to 27,000.
We are however seeing a rise of some non-HIV related causes of death. For example recorded diabetes deaths--in 6th place, having risen from 13th place (for natural causes) in 2004--have increased from under 20,000 in 2008 to over 21,000 in 2010. This is worrying; we should be reducing diabetes deaths. But the rise since 2008 could be explained by population growth as opposed to a worsening diabetes epidemic.
One issue that has caused confusion is that HIV itself is quite low down the list of underlying natural causes of death, in 7th place. When Mbeki wrote his letter to Tshablala-Msimang it was much lower still.
If someone has HIV and dies of TB, strictly speaking their underlying cause of death is supposed to be classified as HIV not TB. The same goes for diarrhoea, pneumonia and other HIV-related causes of death. But this more often than not does not happen and there are plausible, albeit speculative, reasons for this. One commonly given reason is that doctors who fill in death certificates often do not record HIV in order to protect the family of the deceased, perhaps out of fear of stigma or life insurance companies getting hold of the certificate. So instead doctors write down the infection that caused death (e.g. TB, diarrhoea, pneumonia etc). Evidence for this is that as openness about HIV has increased and the fear of insurance companies getting hold of death certificate data has perhaps receded, the number of recorded HIV deaths has risen from 12,000 in 2003 to 18,000 in 2010, while in fact the real number of HIV deaths is orders of magnitude bigger and has probably declined since 2003.
This explains some of the discrepancy, but I suspect there is a more mundane reason that accounts for much more of the underreporting of HIV as the underlying cause of death. Many people die of AIDS without having found out their status or without having informed their latest doctor. A person could one day be more or less healthy at home and then admitted to hospital with, say, TB and die without an HIV diagnosis being made. A doctor filling out a death certificate for such a person would not be able to give HIV as the underlying cause of death because the patient's HIV status, while suspected, would actually be unknown. How many people die this way each year in South Africa? I would guess tens of thousands and this could easily explain why HIV as the underlying cause of death is under-reported.
Why tens of thousands? Because we know from surveys that a large number of people with HIV do not know their status, so it is plausible that many of them will fall ill and die before finding out. Also we know that a significant percentage of patients are lost to follow-up from antiretroviral treatment sites and then later die, often no doubt without the care of an institution, following which their death certificate is filled out by a doctor who might never have met the patient or only saw the patient in his or her final days. So the opportunistic infection cause of death is recorded. I emphasise this is speculative.
Incidentally, many Stats SA death categories are under-recorded, not just HIV. TB deaths are considerably higher than the Stats SA data, same with transport deaths. The Stats SA report is good for providing the overall number of natural and unnatural deaths broken down by age, sex and province, but many of the deaths are misclassified or categorised as "ill-defined".
Over a decade ago, Stats SA did an important study that analysed a large random sample of death certificates from 1997 to 2001 to see what the underlying causes of death really were. Using this more careful methodology, they found that in 1997 HIV was the fourth-largest cause of death. By 2001 it was only exceeded by TB. The number of TB deaths had risen dramatically too over this period, suggesting that many of these were actually HIV deaths and that HIV was already the largest cause of death in 2001. 15 Then in 2009, Beatrice Nojilana and colleagues from the Medical Research Council analysed nearly 1,000 death certificates at a Cape Town hospital. Nearly every one had an error, mostly with the cause of death. They estimated that AIDS deaths were under-reported by more than 50%. 16
To summarise, these studies tell us the following:
Deaths increased dramatically in South Africa between 1997 and 2007, especially among young adults. The biggest increases in recorded deaths were in diseases associated with HIV. Closer analyses of death certificates have found that HIV deaths are massively under-reported. Only HIV can explain the increase in deaths.
The state's antiretroviral treatment and prevention programmes have been scaled up over the last decade, especially since 2004. By 2011, there were nearly 1.8 million people on treatment. People stable on treatment have life-expectancy approaching people without HIV.
Since 2007 deaths have come down sharply and this has coincided with the scaling up of the antiretroviral programme. The only coherent explanation for the decline in deaths is that people with HIV who would otherwise have died are now alive due to antiretroviral treatment. There are however still hundreds of thousands of HIV deaths a year.
The provision of antiretroviral treatment in public health facilities has been one of the most--perhaps the very most--beneficial programme implemented by the post-apartheid state. This is confirmed by the studies described here which put into sharp focus how important the campaign for treatment was in the 2000s, and how misguided the AIDS denialist response was.
These promising data should not make us complacent. There is no guarantee the increase in life-expectancy will continue. The South African public health system is under tremendous strain and in many instances it is broken. If drug stockouts get worse we could see a rise in resistance to AIDS drugs. If the drug-resistant TB epidemic is not brought under control we could see TB deaths going up again, as well as patients lost to the health system, followed by increases in mortality. Continued civil society activism and vigilance is needed to make sure that does not happen.
The number of people on treatment will need to continue to grow for a long time to come; there are over 5 million people with HIV and nearly all will need antiretrovirals at some point. The cost and stress on the health system is considerable, but as the promising results described here show, if you believe that people with HIV should be able to live full and healthy lives, it is worth it.
I am grateful to Marcus Low, Polly Clayden, Nicoli Nattrass and Edwin Cameron who commented on drafts of this article. Thanks to Candy Day for improving my understanding of death notifications. I take sole responsibility for the views and errors in this article. This article may be reproduced without permission but it may not be modified. The original version is published on HIV i-Base. Corrections, if needed, will be made on the i-Base website.
Mbeki T. 2001. Letter to Minister of Health. http://www.nelsonmandela.org/omalley/cis/omalley/OMalleyWeb/03lv03445/04lv04206/05lv04302/06lv04303/07lv04307.htm ↩
Cherry M. 2001. Mbeki disputes AIDS statistics. Nature Medicine 7, 1170 (2001) doi:10.1038/nm1101-1170. http://usrexp-sandbox.nature.com/nm/journal/v7/n11/full/nm1101-1170.html ↩
Geffen, N. 2004. Rian Malan Spreads Confusion about AIDS Statistics. http://www.tac.org.za/newsletter/2004/ns20_01_2004.htm ↩
Chigwedere P et al. Estimating the lost benefits of antiretroviral drug use in South Africa. JAIDS October 16, 2008. http://www.ncbi.nlm.nih.gov/pubmed/19186354 ↩
Nattrass, N. AIDS and the Scientific Governance of Medicine in Post-Apartheid South Africa. African Affairs 2008 107(427):157-176. http://www.yale.edu/macmillan/apartheid/nattrassp2.pdf ↩
Keller, B. 2013. The Heretic. NYRB 21 March. http://www.nybooks.com/articles/archives/2013/mar/21/heretic-rian-malan/ ↩
Johnson L et al. 2013. Life Expectancies of South African Adults Starting Antiretroviral Treatment: Collaborative Analysis of Cohort Studies. PLoS Med 10(4): e1001418. doi:10.1371/journal.pmed.1001418. http://www.plosmedicine.org/article/info:doi/10.1371/journal.pmed.1001418 ↩
Statistics South Africa. 2013. P0309.3 - Mortality and causes of death in South Africa 2010: Findings from death notification. http://www.statssa.gov.za/Publications/statsdownload.asp?PPN=P0309.3&SCH=5490 ↩
Johnson L. 2012. Access to antiretroviral treatment in South Africa, 2004-2011. Southern African Journal of HIV Medicine, Vol 13, No 1 (2012). http://www.sajhivmed.org.za/index.php/sajhivmed/article/view/805/654 ↩
Actuarial Society of South Africa. 2011. [ASSA2008 model provincial outputs. http://aids.actuarialsociety.org.za/ASSA2008-Model-3480.htm](ASSA2008 model provincial outputs. http://aids.actuarialsociety.org.za/ASSA2008-Model-3480.htm ↩
Statistics South Africa. 2013. Census 2011. http://www.statssa.gov.za/Census2011/Products/Census_2011_Fact_sheet.pdf ↩
World Health Organisation. Road safety status profile of South Africa. http://www.who.int/violence_injury_prevention/road_safety_status/country_profiles/south_africa.pdf ↩
Road Traffic Management Corporation. Road Traffic Report 2011. http://www.arrivealive.co.za/documents/March%202011%20Road%20Traffic%20Report.pdf ↩
Bradshaw D et al. 2012. Rapid Mortality Surveillance Report 2011. MRC and CARE. http://www.mrc.ac.za/bod/RapidMortality2011.pdf ↩
Statistics South Africa. 2002. Causes of death in South Africa 1997-2001: Advance release of recorded causes of death. https://dl.dropboxusercontent.com/u/193052/PrimaryDocuments/StatsSA/CausesOfDeath1997-2001.pdf ↩
Nojilana B et al. 2009. Quality of cause of death certification at an academic hospital in Cape Town, South Africa. S. Afr. med. j. vol.99 no.9. http://www.scielo.org.za/scielo.php?pid=S0256-95742009000900018&script=sci_arttext ↩
